


Alright, let’s cut to the chase.
You’ve got reams of data, endless spreadsheets, and enough metrics to make an analyst weep. But somehow, you’re still missing the mark on turning all that info into actionable business strategies. The problem? It’s not the data (I mean, data doesn’t lie, right?). It’s how you’re using it—or rather, not using it.
I’m Viktor, a pitch deck consultant and a creative business strategist. Over the past 13 years, I’ve helped businesses secure millions of $ in funding thanks to my approach and I’m sharing it here in this pitch deck guide.
And now? I’m here to show you how to use your data like a pro so that your pitch stops gathering dust on a VC’s desk.
So, buckle up. Whether you’re trying to convince a room full of skeptical suits or just your over-caffeinated boss, I’ve got the blueprint to turn those mountains of data into insights that actually drive decisions. Let’s roll.
Pushing Case Studies Like Pushing Code: Check out our case study on how we helped a SaaS platform for HR develop a pitch deck to raise funding for their next round.
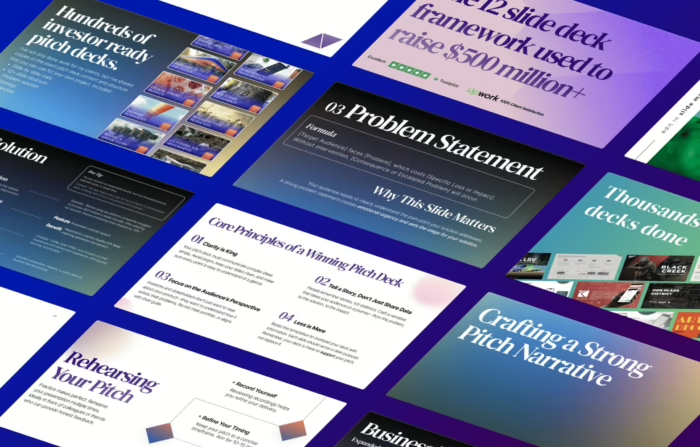
Get My 12 Slide Framework That Got $500mil in Funding For Clients.
What do you think of having 12 dead simple formulas, that will help you craft 12 slides, in about 1 hour? That’s what you’ll get, when you download my 12 slide framework. Save hours crafting your pitch deck copy with my tested approach that includes:
- Elevator pitch one sentence formula
- Problem/ solution slide one sentence formula
- Competitor slide one sentence formula
- 9 other formulas, tips, tricks and advice
The formulas worked for 40+ industries and 500+ companies. Including the one you’re looking at now.
Clicking the link won’t charge you anything.
14 Slide B2B Data Solutions Pitch Deck Template | Google Slides
The above is is just a simplified template.
Founders that are serious about getting the funding they need, opt in for a deck has industry specific content, superb narrative and award winning design like these ones below:


I can help you build that deck with my hands-off process in 7 days or less.
Book a free 30 minute call below if you’re serious about getting an investor ready deck, and we’ll discuss your needs in detail. I’ll help you design the deck, write the content, develop the narrative and flesh out the strategy with financials.


Follow us on social for the newest templates:
Slide 1: Elevator Pitch
Headline: “Unlocking Data-Driven Decisions for Enhanced Business Performance”
Content:
- Value Proposition: “Our platform enables businesses to seamlessly integrate and analyze data, reducing decision-making time by 40% and uncovering hidden growth opportunities.”
- Target Audience: Medium to large enterprises across various industries seeking to optimize operations through data insights.
- Key Benefit: Empowering organizations to make informed decisions swiftly, leading to increased efficiency and profitability.
Visuals:
- An infographic illustrating the reduction in decision-making time and the discovery of new opportunities.
Slide 2: Investor Memo
Headline: “Strategic Investment Opportunity in the Booming Data Analytics Market”
Content:
- Market Opportunity: The global data analytics market was valued at approximately USD 54.37 billion in 2023 and is projected to reach USD 293.42 billion by 2032, growing at a CAGR of 20.6% during 2024–2032.
- Traction: Achieved $5 million in annual recurring revenue (ARR) with a 50% year-over-year growth rate.
- Funding Requirements: Seeking $10 million to enhance product capabilities and expand market reach.
- Vision: To become the leading data solutions provider, enabling businesses worldwide to harness the full potential of their data.
Visuals:
- Bullet points highlighting key information for quick comprehension.
Slide 3: Problem Statement
Headline: “Challenges in Harnessing Data for Business Growth”
Content:
- Data Fragmentation: Businesses struggle with disparate data sources, leading to inefficiencies.
- High Costs: Maintaining legacy systems is expensive and resource-intensive.
- Missed Opportunities: Lack of real-time insights results in missed market opportunities.
Visuals:
- A flowchart depicting the current fragmented data landscape and its inefficiencies.
Slide 4: Solution Overview
Headline: “Introducing [Your Solution]: Unified Data Integration and Analytics Platform”
Content:
- Comprehensive Integration: Connects various data sources into a single platform.
- Real-Time Analytics: Provides immediate insights and predictive analytics.
- Scalability: Adapts to the evolving needs of businesses across industries.
Visuals:
- A diagram showcasing the platform’s integration process and user interface.
Slide 5: Market Opportunity
Headline: “Capitalizing on a Rapidly Expanding Data Analytics Market”
Content:
- Market Size: The global data analytics market is projected to grow from USD 51.55 billion in 2023 to USD 279.31 billion by 2030, exhibiting a CAGR of 27.3% during 2023–2030.
- Demand Drivers:
- Increasing adoption of big data and predictive analytics.
- Growing need for data-driven decision-making across industries.
- Competitive Landscape: Opportunity to offer superior solutions in a fragmented market.
Visuals:
- A bar graph illustrating market growth projections.
Slide 6: Competitive Landscape
Headline: “Our Distinct Advantage in the Data Solutions Arena”
Content:
- Key Competitors: Overview of major players in the data analytics market.
- Our Differentiators:
- Faster integration capabilities.
- Cost-effective solutions.
- Advanced AI-powered analytics.
- Customer Feedback: Testimonials highlighting our platform’s superior performance.
Visuals:
- A comparison matrix showcasing our advantages over competitors.
Hold on. You might want to check my list on the best presentation and communication books...
These are crucial books that will help you improve the design and structure of your decks and presentations, besides improving your delivery and skyrocketing your confidence when facing investors. Check them out below.

Slide 7: Customer Success Stories
Headline: “Driving Success Across Diverse Industries”
Content:
- Case Study 1: Assisted [Client A] in reducing operational costs by 30% through data optimization.
- Case Study 2: Enabled [Client B] to increase data processing speed by 50%, enhancing productivity.
- Case Study 3: Supported [Client C] in uncovering new market opportunities, leading to a 20% revenue boost.
Visuals:
- Customer testimonials and logos of notable clients.Slide 8: How It Works
Headline: “Simplifying Data Integration and Analysis”
Content:
- Data Ingestion: Our platform seamlessly connects to various data sources, including databases, cloud services, and APIs, ensuring comprehensive data collection.
- Real-Time Processing: Utilizes advanced algorithms to process data in real-time, providing immediate insights and analytics.
- User-Friendly Interface: Features an intuitive dashboard that allows users to customize reports, visualize data trends, and generate actionable insights without requiring technical expertise.
Visuals:
- A step-by-step infographic illustrating the data flow from ingestion to actionable insights.
Slide 9: Business Model
Headline: “Scalable and Flexible Revenue Streams”
Content:
- Subscription Tiers:
- Basic: $500/month – Includes core data integration and analytics features.
- Pro: $1,200/month – Adds advanced analytics, predictive modeling, and priority support.
- Enterprise: Custom pricing – Offers full platform access, dedicated account management, and tailored solutions.
- Additional Revenue Streams:
- Professional Services: Custom data consulting and implementation support.
- Training Programs: Workshops and webinars to help clients maximize platform utilization.
Visuals:
- A table comparing features and pricing across subscription tiers.
Slide 10: Financial Projections
Headline: “Projected Financial Growth Over the Next Five Years”
Content:
- Year 1:
- Revenue: $2 million
- Expenses: $1.5 million
- Net Profit: $500,000
- Year 2:
- Revenue: $5 million
- Expenses: $3 million
- Net Profit: $2 million
- Year 3:
- Revenue: $10 million
- Expenses: $6 million
- Net Profit: $4 million
- Year 4:
- Revenue: $18 million
- Expenses: $10 million
- Net Profit: $8 million
- Year 5:
- Revenue: $30 million
- Expenses: $15 million
- Net Profit: $15 million
Assumptions:
- Annual customer growth rate of 50%.
- Churn rate maintained below 5%.
- Consistent upsell to higher subscription tiers.
Visuals:
- A line graph depicting revenue and net profit growth over five years.
Slide 11: Go-To-Market Strategy
Headline: “Strategic Plan to Capture Market Share”
Content:
- Target Industries: Finance, Healthcare, Manufacturing, and Retail.
- Marketing Channels:
- Content Marketing: Publishing whitepapers, case studies, and blog posts to establish thought leadership.
- Webinars and Workshops: Hosting events to demonstrate platform capabilities and engage potential clients.
- Partnerships: Collaborating with industry associations and technology partners to expand reach.
- Sales Strategy:
- Direct Sales Team: Focused on enterprise clients with personalized outreach.
- Inside Sales: Handling small to medium-sized businesses through digital channels.
Visuals:
- A timeline highlighting key milestones and initiatives over the next 12 months.
Slide 12: Team & Advisors
Headline: “Experienced Leadership Driving Innovation”
Content:
- CEO – [Name]: Over 15 years in data analytics and former VP at [Company].
- CTO – [Name]: Expert in big data technologies with a Ph.D. in Computer Science.
- COO – [Name]: Led operations at [Company], scaling teams from 50 to 200 employees.
- Advisors:
- [Name]: Former CIO at [Fortune 500 Company], providing strategic guidance.
- [Name]: Venture capitalist with a focus on tech startups, advising on fundraising and growth.
Visuals:
- Professional photos of the team with brief bios highlighting key achievements.
Slide 13: The Ask
Headline: “Join Us in Transforming Data Analytics”
Content:
- Funding Requirement: Seeking $10 million in Series A funding.
- Use of Funds:
- Product Development: $4 million to enhance platform features and scalability.
- Sales and Marketing: $3 million to expand market presence and customer acquisition.
- Talent Acquisition: $2 million to hire top-tier engineers and data scientists.
- Operational Expenses: $1 million for infrastructure and administrative costs.
Visuals:
- A pie chart illustrating the allocation of funds across different categories.
Slide 14: Closing & Call to Action
Headline: “Partner with Us to Lead the Data Revolution”
Content:
- Vision Recap: Empowering businesses to unlock the full potential of their data, driving innovation and growth.
- Call to Action: “We invite you to join us on this journey. Let’s schedule a meeting to discuss how we can collaborate and invest in the future of data analytics.”
Visuals:
- A high-impact image depicting a visionary landscape, symbolizing the future of data-driven decision-making.
- Contact Information: Ensure clear details for follow-up, such as email, phone, and LinkedIn profiles of key team members.
Design Tips for the Deck:
- Visual Consistency:
- Stick to a consistent color palette and font style throughout the presentation.
- Use high-quality images and icons to break up text-heavy slides.
- Minimalist Approach:
- Keep text minimal; aim for bullet points and short, impactful sentences.
- Use visuals (graphs, charts, infographics) to convey data rather than long text explanations.
- Data Visualization:
- Use charts and graphs to simplify complex data on slides like Market Opportunity, Financial Projections, and How It Works.
- Ensure data points are easy to read and understand.
- Call-to-Action Emphasis:
- End the presentation with a clear, compelling call to action to encourage potential investors to take the next step.
Pick a specific pitch deck design from the award winning Envato.
1000’s of ready made Powerpoint, Google Slides, and Keynote presentations that are easy to edit, format and tailor to your idea.
Last Words
By now, you’ve got the tools, the template, and the playbook to create a pitch that actually gets heard. But here’s the thing—having all this info means squat if you don’t use it. If you’re still clinging to your 50-slide deck with more text than a Tolstoy novel, it’s time to let go, my friend.
Think of your data as your secret weapon—not the kind that bores your audience to death, but the kind that gets them leaning in, nodding, and eventually signing on the dotted line. You’ve got this. If your pitch doesn’t make people sit up in their chairs, it’s not the data’s fault—it’s time to switch up the strategy.
Now go out there and make your data work for you. And hey, if you ever need a pitch whisperer, you know where to find me. Cheers to your next big win!
You got this!
Related Data Pitch Deck Templates

13 Slide Decentralized Data Management Pitch Deck Template | Google Slides
Ever feel like your data’s out in the wild west—exposed, uncontrolled, and one server crash…
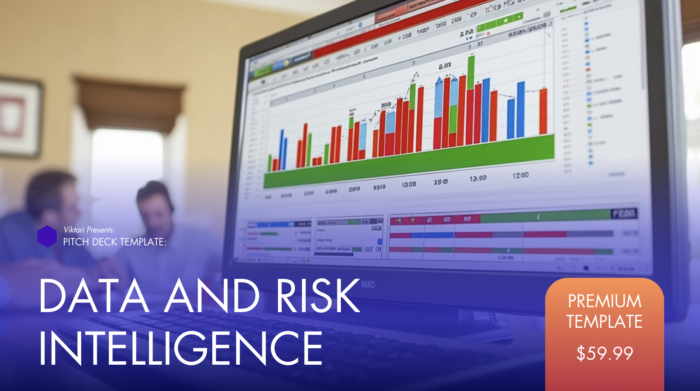
11 Slide Data and Risk Intelligence Pitch Deck Template | Google Slides
So, here’s the deal: you’ve got a killer concept for a data and risk intelligence…
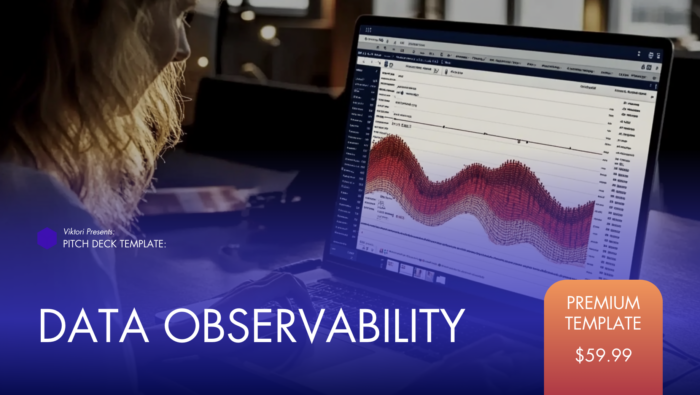
11 Slide Data Observability Pitch Deck Template | Google Slides
You’ve got the next big thing in data—seriously, your insights could save companies millions, maybe…
12 Slide B2B Data Solutions Pitch Deck Template | Google Slides
Alright, let’s cut to the chase. You’ve got reams of data, endless spreadsheets, and enough…
11 Slide Enterprise Data Solutions Pitch Deck Template | Google Slides
Alright, here’s the scenario: Your company has loads of data, but instead of running like…
10 Slide Data Observability Tools Pitch Deck Template
You’ve got a mountain of data, but let’s be real—it’s a mess. There’s a data…

16 Slide Next Gen Ai Data Centers Pitch Deck Template
So, you’ve got this killer AI project that’s set to change the game. The algorithms…
12 Slide Big Data Pitch Deck Template | Google Slides
17 Slide Data Analytics Pitch Deck Template | Google Slides
So, here’s the thing: you’ve got heaps of data, and everyone keeps telling you there’s…
Looking for a step by step guide to build a data startup pitch deck?
Check out our in-depth data pitch deck guide.
Check out some of the essential 101 guides:

Top Pitch Deck Design Agencies for Investor-Ready Presentations
Quick Summary A pitch deck design agency helps startups turn complex business ideas into clear,…

How to Create a High-Impact Investment Highlights Slide For Your Pitch Deck
An investment highlights slide is often the moment in a pitch deck when investors decide…

The Why Now Slide in a Startup Pitch Deck
The why now slide explains one simple thing: why this opportunity makes sense right now,…

How to Make a Pecha Kucha Presentation: The 20×20 Format Explained
If you’ve ever sat through a bloated 40-slide presentation that could’ve been said in 10…
5 Types of Pitch Decks And How To Choose The Right One
A pitch deck isn’t “a deck.” It’s a decision surface—a compressed view of a business…
Pitch Deck vs Pitch Book: Investor Guide to Key Differences
Choosing between a pitch deck vs pitchbook matters because each format reflects a different evaluation…