


A financial projection slide shows investors how your business could grow over time.
It usually includes forecasted revenue, costs, margins, profit or loss, cash needs, and the assumptions behind the numbers.
But the real purpose of the slide is not to prove that the future will happen exactly as planned.
No serious investor expects your projections to be perfectly accurate.
What they want to understand is how you think.
They want to know:
- Can this founder connect the business model to the numbers?
- Are the growth assumptions believable?
- Does the revenue model make sense?
- Do costs scale logically?
- Is the company aware of burn, runway, and capital needs?
- Does the forecast support the fundraising ask?
- Is the opportunity big enough to justify the risk?
A strong financial projection slide makes the business feel more understandable.
A weak financial projection slide makes the business feel speculative, inflated, or disconnected from reality.
The goal is not to impress investors with large numbers. The goal is to show financial logic that can be questioned, tested, and believed.
What Is a Financial Projection Slide?
A financial projection slide is the part of a pitch deck that summarizes the company’s expected financial performance over a future period.
Most financial projection slides show a three-year or five-year forecast.
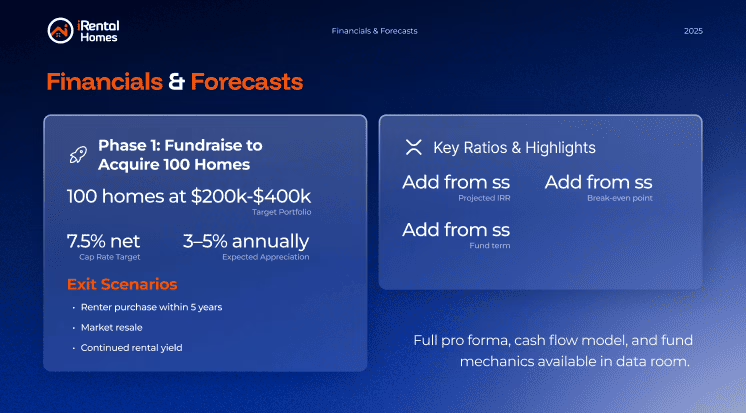
The slide may include:
- revenue
- gross margin
- operating expenses
- EBITDA or profit/loss
- cash burn
- runway
- customers or units sold
- major growth drivers
- key assumptions
The financial projection slide is not the full financial model.
The full model lives in a spreadsheet.
The pitch deck slide is the simplified investor-facing version of that model.
Its job is to help investors understand the financial story quickly without forcing them to read a spreadsheet during the presentation.
A good financial projection slide should answer:
- How does the company expect to grow?
- What drives that growth?
- What costs are required to support it?
- When does the company become more efficient?
- How much capital is needed to reach the next milestone?
- What assumptions are behind the forecast?
The best version is simple enough to read in a few seconds, but specific enough to show that the founder understands the business.
Why Investors Care About the Financial Projection Slide
Investors care about the financial projection slide because it reveals how the founder thinks about growth, risk, and capital.
The numbers themselves matter.
But the thinking behind the numbers matters more.
Investors are usually looking for signals like:
- whether the revenue forecast is believable
- whether the business model is clear
- whether the cost structure makes sense
- whether the company understands gross margin
- whether growth depends on realistic assumptions
- whether the fundraising ask matches the plan
- whether the company knows what it must prove next
- whether the projections are aggressive but not ridiculous
A strong financial projection slide gives investors confidence that the founder can think commercially.
A weak slide creates doubt.
That doubt can show up in different ways.
The investor may not believe the growth rate.
They may question pricing.
They may doubt customer acquisition.
They may think the team is underestimating costs.
They may wonder why the company needs the amount of money it is raising.
They may feel the founder is using numbers to decorate the deck rather than explain the business.
This is why financial projections should not be treated as a formality.
They are part of the investor argument.
Financial Projection Slide vs Financial Model
The financial projection slide and the financial model are related, but they are not the same thing.
Financial Model
The financial model is the detailed spreadsheet.
It includes the underlying calculations, formulas, assumptions, revenue build, hiring plan, costs, margins, cash flow, and scenarios.
Investors may review this separately after the pitch or during diligence.
Financial Projection Slide
The financial projection slide is the simplified version shown in the pitch deck.
It should summarize the most important financial story.
It should not show every formula.
It should not include dozens of rows.
It should not look like a screenshot of Excel.
The financial model supports the slide.
The slide communicates the story.
That distinction matters because many founders either show too little or too much.
Too little makes the forecast feel vague.
Too much makes the slide impossible to read.
The right balance is to show the forecast clearly, then support it with assumptions and logic.
Financial Projection Slide vs Revenue Model Slide
The revenue model slide explains how the business makes money.
The financial projection slide shows how that model may perform over time.
For example, the revenue model slide might explain that a SaaS company sells annual subscriptions at a $24K average contract value.
The financial projection slide then shows how revenue grows as the company acquires more customers, expands accounts, improves retention, and increases sales capacity.
The revenue model is the mechanism.
The financial projection is the forecast.
These two slides need to support each other.
If the revenue model slide says growth comes from enterprise contracts, the financial projection slide should reflect enterprise sales cycles, contract value, sales hiring, onboarding, and retention.

If the revenue model slide says growth comes from consumer product sales, the financial projection slide should reflect units sold, pricing, gross margin, inventory, distribution, and repeat purchase behavior.
If the two slides do not match, investors will notice.
How the Financial Projection Slide Connects to Pitch Deck Financials
The financial projection slide is one part of the broader financial story in a pitch deck.
It should connect to the revenue model, use of funds, burn rate, runway, assumptions, KPIs, and fundraising ask.
For a broader breakdown of financial slides, read my guide on how to present financials in a pitch deck.
That parent guide covers the full financial section.
This page focuses specifically on how to structure and present the financial projection slide.
What to Include in a Financial Projection Slide
A strong financial projection slide usually includes a few core elements.
You do not need to include every financial line item, but the slide should show enough to make the forecast understandable.
Forecast Period
Most pitch decks use a three-year or five-year projection.
Three years is usually enough for early-stage companies because the future becomes increasingly uncertain.
Five years can make sense for companies where long-term scale matters, such as SaaS, infrastructure, real estate, energy, biotech, healthcare, or fund-related businesses.
The mistake is pretending that a five-year projection is precise.
It is not.
It is a directional view of how the business could scale if the assumptions are true.
Revenue
Revenue is usually the most important line on the projection slide.
Show how revenue grows over time.
But do not only show the final number.
Investors need to understand what drives the growth.
For example:
- customers
- contracts
- units sold
- transaction volume
- average order value
- pricing
- retention
- expansion
- locations
- distribution points
- occupancy
- utilization
A revenue forecast without drivers is just a number.
A revenue forecast with drivers becomes a business argument.
Cost of Goods Sold or Direct Costs
If your business has direct costs, show them clearly.
This matters for:
- consumer products
- manufacturing
- marketplaces
- healthcare
- infrastructure
- logistics
- hardware
- food and beverage
- real estate projects
- service businesses
Direct costs help investors understand gross margin.
If you show revenue growing but ignore the costs required to deliver that revenue, the projection will feel incomplete.
Gross Margin
Gross margin is one of the most useful financial signals in a pitch deck.
It shows how much revenue remains after direct costs.
For SaaS, investors may expect strong gross margins.
For consumer products, hardware, logistics, or marketplace businesses, gross margin may be lower or more complex.
The important thing is not to fake it.
Show the margin logic that fits the business.
If margins improve over time, explain why.
For example:
- better supplier terms
- higher pricing power
- improved automation
- lower delivery costs
- more efficient onboarding
- higher utilization
- product mix shift
- software replacing manual service work
Do not show margin improvement without explaining the reason.
Operating Expenses
Operating expenses usually include the costs needed to run and grow the business.
Common categories include:
- salaries
- sales and marketing
- product development
- engineering
- operations
- customer success
- general and administrative costs
- legal and compliance
- rent or facilities
- software and tools
The projection slide does not need every cost line.
But it should show the main expense structure.
Investors want to understand how much spending is required to produce the forecasted growth.
EBITDA, Profit, or Net Income
Depending on the business, you may show EBITDA, operating profit, or net income.
Early-stage startups are often not profitable yet, so this line may be negative for several years.
That is not automatically a problem.
The problem is when the losses do not make sense.
If losses increase because the company is investing heavily in growth, explain the logic.
If the company becomes profitable later, show what changes.
Do margins improve?
Does revenue scale faster than costs?
Does customer acquisition become more efficient?
Does the team stop hiring aggressively?
Does retention improve?
Does operating leverage appear?
Investors want to understand the path.
Burn Rate and Runway
For early-stage companies, cash burn and runway are often more important than profit.
Burn rate shows how much cash the company spends each month.
Runway shows how long the company can operate before needing more capital.
For a deeper breakdown of how burn, runway, cash timing, and milestone planning should be explained, read my guide on burn rate and runway in a pitch deck.
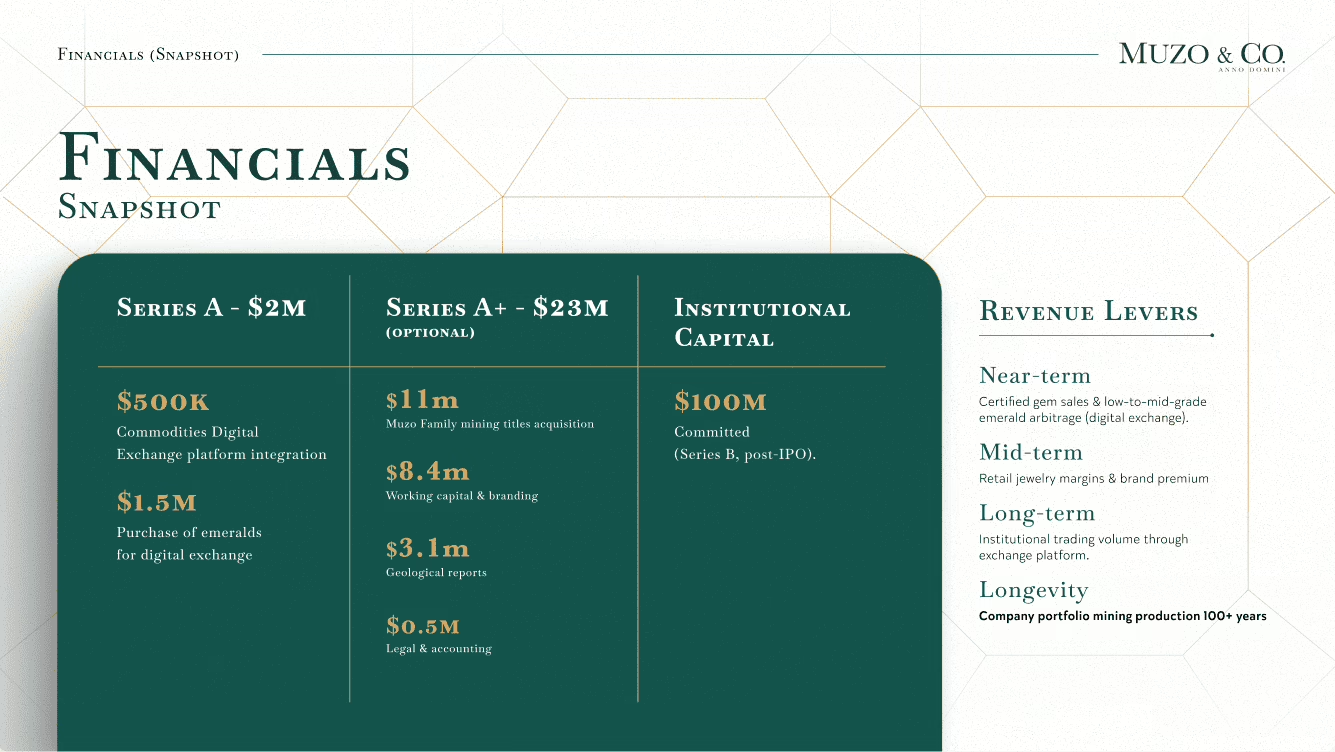
The financial projection slide should connect to the funding round.
If you are raising $2M, the slide should make it clear what that capital supports.
For a deeper breakdown of how the raise amount connects to milestones, read my guide on the use of funds slide.
Key Assumptions
This is where many projection slides become stronger.
Do not only show the forecast.
Show the assumptions behind it.
Examples:
- average contract value
- customer acquisition rate
- conversion rate
- churn
- renewal rate
- gross margin
- average order value
- units sold
- retail locations
- occupancy rate
- utilization
- sales cycle length
- pricing
- hiring plan
Assumptions make the forecast easier to evaluate.
Investors do not need to agree with every assumption.
But they need to see that the assumptions exist.
A forecast with visible assumptions feels more credible than a forecast that simply says revenue will grow from $500K to $25M.
The Real Job of the Financial Projection Slide
The real job of the financial projection slide is not to predict the future.
The real job is to show the relationship between growth, cost, capital, and risk.
A strong projection slide says:
“This is how the business grows if the main assumptions hold.”
It also shows:
“This is what we need to spend to reach that growth.”
And:
“This is what the current funding round helps us unlock.”
That is why the financial projection slide should not be isolated from the rest of the deck.
It needs to connect to:
- the revenue model
- the go-to-market strategy
- the use of funds
- the hiring plan
- the traction
- the fundraising ask
- the next milestone
If the financial projection slide does not connect to the rest of the story, it feels like decoration.
If it does connect, it strengthens the entire pitch.
Good vs Bad Financial Projection Slides
A bad financial projection slide usually looks impressive at first glance, but falls apart when questioned.
A good financial projection slide makes the assumptions and growth logic clear.
Bad Financial Projection Slide
A weak slide might show a table like this:
Year 1 revenue: $500K
Year 2 revenue: $5M
Year 3 revenue: $25M
Year 4 revenue: $80M
Year 5 revenue: $200M
At first, this looks ambitious.
But investors will ask:
Where does the growth come from?
How many customers does this require?
What is the pricing?
What is the sales cycle?
What are the margins?
How much does the team need to spend?
What capital is needed to reach those numbers?
What assumptions drive the forecast?
If the slide cannot answer those questions, the projection becomes hard to believe.
The issue is not ambition.
The issue is unsupported ambition.
Better Financial Projection Slide
A stronger version might show:
Revenue grows from $500K to $12M over three years.
Drivers:
- 25 customers in Year 1
- 90 customers in Year 2
- 220 customers in Year 3
- $48K average contract value
- 88% gross margin
- 92% annual retention
- sales team expands from 2 to 8 reps
- this round funds 18 months of runway
This version is stronger because the investor can see how the forecast works.
They may still challenge the assumptions.
That is normal.
But now the conversation becomes specific.
Instead of saying, “I don’t believe your numbers,” the investor can ask:
“Can you really reach 220 customers?”
“Is the $48K contract value proven?”
“What is the sales cycle?”
“What happens if retention is lower?”
“How much capital is required before this becomes efficient?”
That is a much better conversation.
Financial Projection Slide Examples by Business Type
Different business models need different financial projection slides.
Do not use the same structure for every company.
The right slide depends on how the business makes money.
SaaS Financial Projection Slide
For SaaS, the projection slide should usually show recurring revenue growth.
Common metrics include:
- ARR or MRR
- number of customers
- average contract value
- gross margin
- churn
- net revenue retention
- sales and marketing spend
- CAC payback
- EBITDA or operating loss
Example framing:
Revenue grows from $500K ARR to $8M ARR over three years, driven by new customer acquisition, account expansion, and strong gross retention.
A SaaS projection slide should not only show revenue.
It should show the subscription logic behind revenue.
Marketplace Financial Projection Slide
For marketplaces, the projection slide should show transaction activity.
Common metrics include:
- gross merchandise value
- transaction volume
- average order value
- take rate
- active buyers
- active sellers
- repeat usage
- contribution margin
Example framing:
Revenue grows as transaction volume increases, average order value improves, and the platform maintains a 12% take rate.
The key is to show the movement from marketplace activity to revenue.
Consumer Product Financial Projection Slide
For consumer products, the projection slide should connect sales volume, margin, and distribution.
Common metrics include:
- units sold
- average selling price
- gross margin
- direct-to-consumer revenue
- wholesale revenue
- retail locations
- repeat purchase rate
- inventory requirements
Example framing:
Revenue grows through direct-to-consumer sales, wholesale expansion, repeat purchase, and SKU growth.
The slide should make inventory and margin visible because consumer product growth often requires working capital.
Healthcare Financial Projection Slide
Healthcare projections need to be especially clear because revenue can depend on buyers, payers, reimbursement, providers, or enterprise contracts.
Common metrics include:
- clinics or provider customers
- patient volume
- annual contract value
- reimbursement assumptions
- provider adoption
- gross margin
- implementation cost
- sales cycle length
Example framing:
Revenue grows through annual platform contracts with clinics, supported by expansion across provider groups and patient volume.
The slide should make clear who pays and how revenue is recognized.
Real Estate or Infrastructure Financial Projection Slide
For real estate, energy, and infrastructure projects, projections usually focus on asset economics.
Common metrics include:
- development cost
- rental income
- occupancy
- operating income
- project yield
- utilization
- contracted revenue
- operating costs
- cash flow
- refinancing or exit assumptions
Example framing:
Revenue grows as occupancy increases and stabilized operating income improves after project completion.
The financial projection slide should reflect the project timeline, not a generic startup growth curve.
Service Business Financial Projection Slide
For service businesses, projections usually depend on clients, pricing, team capacity, and utilization.
Common metrics include:
- number of clients
- average project value
- retainer revenue
- utilization
- gross margin
- team size
- renewal or repeat work
- operating profit
Example framing:
Revenue grows through larger client engagements, recurring retainers, and higher delivery capacity.
The projection should not pretend service businesses scale like software unless there is a real productized or technology-enabled layer.
Financial Projection Slide by Funding Stage
The financial projection slide should also match the company’s stage.
A pre-seed company should not present numbers like a mature growth-stage company.
Pre-Seed Financial Projection Slide
At pre-seed, the company usually has limited data.
The projection should be simple and assumption-driven.
Focus on:
- current assumptions
- early pricing
- MVP launch
- first users or pilots
- runway
- validation milestones
- expected burn
The goal is not to show perfect financial precision.
The goal is to show that the founder understands what needs to be proven.
Seed Financial Projection Slide
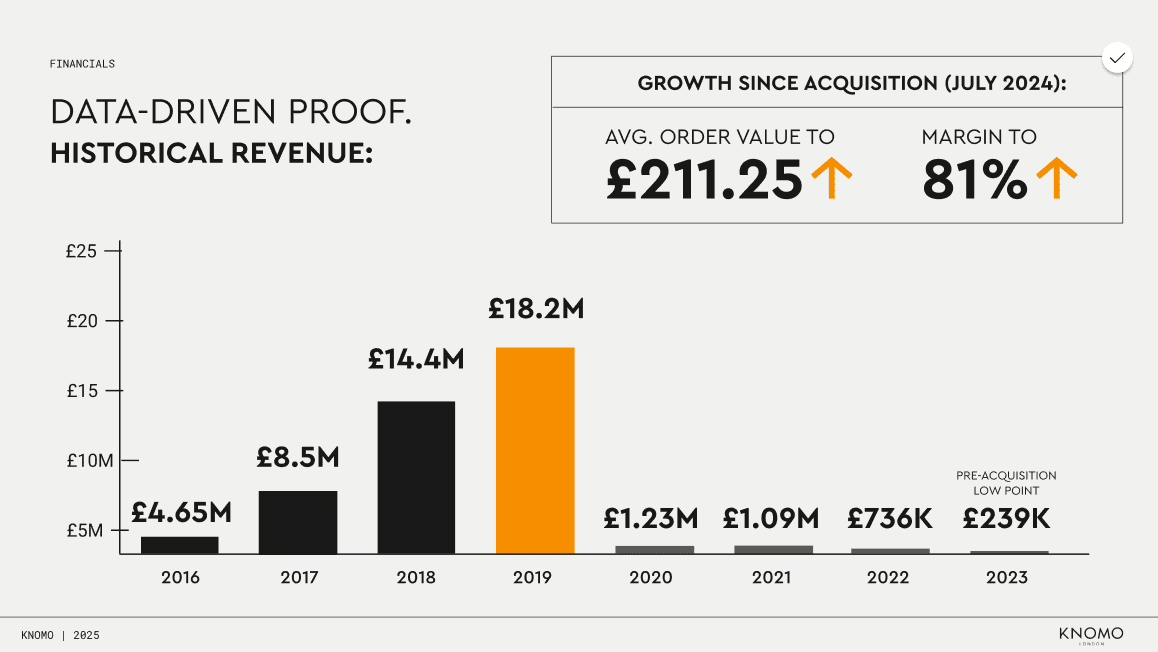
At seed stage, investors usually expect more commercial logic.
Focus on:
- revenue drivers
- customer acquisition
- early traction
- gross margin
- burn rate
- runway
- use of funds
- path to next milestone
The projection should explain how the company moves from early proof to repeatable growth.
Series A Financial Projection Slide
At Series A, the projection slide needs to show scaling logic.
Focus on:
- ARR or revenue growth
- sales efficiency
- margin improvement
- customer retention
- team expansion
- go-to-market investment
- operating leverage
- path to the next round
The numbers need to feel more grounded because the company should have real performance data by this stage.
Series B Financial Projection Slide
At Series B, the projection slide should show how the company scales what is already working.
Focus on:
- revenue scale
- market expansion
- sales team productivity
- retention
- gross margin
- customer success
- operational systems
- profitability path or efficient growth
- future financing or exit readiness
A Series B projection slide should not feel experimental.
It should feel like capital is being deployed into a machine that already has evidence behind it.
How to Design a Financial Projection Slide
The design of the financial projection slide should make the forecast easy to understand.
This is not the place to show a full spreadsheet.
Investors should be able to understand the main financial story quickly.
Use a Simple Table
A simple table often works best.
Use columns for years and rows for the most important financial lines.
Example rows:
- revenue
- gross margin
- operating expenses
- EBITDA
- cash burn
- runway
- customers or units
Keep the table clean.
Do not include twenty rows.
Add a Chart When It Helps
A chart can help show growth, but it should not replace the logic.
A simple bar chart can show revenue growth.
A line chart can show margin improvement.
A stacked bar can show revenue by segment.
But charts should support the forecast, not decorate the slide.
Highlight Key Assumptions
Add a small assumption box.
This is often what makes the slide more credible.
For example:
Key assumptions:
- $24K average contract value
- 85% gross margin
- 12-month sales cycle
- 90% annual retention
- 18 months runway after raise
This gives investors something specific to evaluate.
Show the Takeaway
Every financial projection slide should have a takeaway.
Do not just show numbers.
Add a headline like:
Revenue grows to $8M ARR by Year 3 as sales capacity expands and retention improves.
or:
This round funds 18 months of runway and supports growth from pilot revenue to repeatable enterprise sales.
The headline should explain what the investor should understand from the slide.
Common Financial Projection Slide Mistakes
Most financial projection mistakes happen because founders try to make the numbers look impressive instead of making them believable.
Mistake 1: Unrealistic Revenue Growth
The most common mistake is showing huge revenue growth without explaining what drives it.
A forecast that grows from $100K to $100M in five years may be possible in rare cases, but it needs serious support.
Investors will ask how many customers, units, contracts, or transactions are required.
If you cannot explain that, the forecast loses credibility.
Mistake 2: No Assumptions
A forecast without assumptions is hard to evaluate.
Investors need to know what the numbers depend on.
Add the main assumptions directly on the slide.
Do not hide all of them in the spreadsheet.
Mistake 3: Screenshot of a Spreadsheet
A pitch deck slide should not look like Excel.
Too many rows, tiny text, and dense numbers make the slide unreadable.
Simplify the projection.
Keep the full model separate.
Mistake 4: Costs Do Not Scale With Revenue
Founders often show revenue growing quickly while costs stay unrealistically flat.
That can make the projection look naive.
If revenue growth requires salespeople, engineers, customer support, inventory, compliance, infrastructure, or operations, the costs should reflect that.
Mistake 5: No Burn or Runway
For early-stage companies, burn and runway matter.
If the company is not profitable yet, investors need to understand how much cash is being used and how long the round lasts.
This should connect directly to the fundraising ask and use of funds.
Mistake 6: Financials Do Not Match the Story
The financial projection slide should match the narrative.
If the pitch says the company is product-led, the forecast should reflect that.
If the pitch says growth depends on enterprise sales, the forecast should reflect sales cycles and hiring.
If the pitch says the company is capital-light, the spending should support that.
If the story and numbers disagree, investors will trust neither.
Mistake 7: Too Much Precision
Financial projections are estimates.
Do not pretend they are exact.
Showing too many decimals, tiny categories, or overly detailed future numbers can make the forecast feel fake.
Use clean, rounded numbers where appropriate.
The goal is clarity, not false precision.
How to Connect Financial Projections to the Fundraising Narrative
Financial projections are not separate from the fundraising narrative.
They are one of the strongest ways to show the logic behind the raise.
A good fundraising story says:
Here is where the company is now.
Here is what we have proven.
Here is what we need to prove next.
Here is how much capital we are raising.
Here is how that capital gets us to the next milestone.
Here is what the business could become if the assumptions hold.
The financial projection slide supports that entire argument.
If the forecast feels disconnected from the narrative, the deck becomes weaker.
If the revenue model, assumptions, use of funds, and projections all support the same story, the deck becomes easier to believe.
If the positioning, capital story, or investor logic still feels unclear, you may need fundraising narrative strategy before turning the numbers into slides.
Financial Projection Slide Template
Here is a simple structure you can use.
Headline
Summarize the financial story in one sentence.
Example:
Revenue grows to $8M ARR by Year 3 as enterprise sales capacity expands and retention improves.
Forecast Table
Show three to five years.
Example rows:
- revenue
- gross margin
- operating expenses
- EBITDA
- cash burn
- customers
Key Assumptions
Add a small assumption box.
Example:
- $24K average contract value
- 85% gross margin
- 90% annual retention
- 18 months runway after raise
- sales team expands from 2 to 8 reps
Capital Link
Add a short line connecting the forecast to the raise.
Example:
This round funds 18 months of runway and supports the company through product expansion, sales hiring, and revenue growth.
This simple structure is usually enough for the main deck.
The detailed model can live separately.
Financial Projection Slide Copy Examples
Here are a few examples you can adapt.
SaaS Example
Revenue grows from $500K ARR to $8M ARR over three years, driven by enterprise customer acquisition, account expansion, and strong gross retention.
Marketplace Example
Revenue grows as transaction volume increases, average order value improves, and the platform maintains a 12% take rate across completed bookings.
Consumer Product Example
Revenue grows through direct-to-consumer sales, retail expansion, repeat purchase, and SKU growth, while gross margin improves through better supplier terms.
Healthcare Example
Revenue grows through annual platform contracts with clinics, supported by provider adoption, patient volume, and expansion across care teams.
Real Estate Example
Revenue increases as occupancy rises, operating income stabilizes, and the project moves from development to cash-flowing asset.
Service Business Example
Revenue grows through larger client engagements, recurring retainers, and increased delivery capacity, while margins improve through a more efficient team structure.
Where the Financial Projection Slide Goes in a Pitch Deck
The financial projection slide usually appears after the revenue model, traction, and go-to-market sections.
A typical order might look like this:
- Problem
- Solution
- Product
- Market
- Business model
- Revenue model
- Go-to-market
- Traction
- Financial projections
- Use of funds
- Team
- Ask
The exact order can change.
But the financial projection slide should usually appear after investors understand how the business makes money.
Do not ask investors to believe the forecast before they understand the model.
Need Help Building an Investor-Ready Financial Projection Slide?
A financial projection slide needs to do more than show future numbers.
It has to explain the relationship between revenue, costs, assumptions, capital, runway, and investor narrative.
If you need help turning your financial projections, revenue model, use of funds, and fundraising story into a clearer investor-ready presentation, explore my pitch deck design services.
Financial Projection Slide FAQ
What is a financial projection slide?
A financial projection slide is a pitch deck slide that summarizes the company’s expected future financial performance. It usually shows revenue, costs, margin, profit or loss, burn, runway, and key assumptions.
What should be included in a financial projection slide?
A financial projection slide should usually include forecasted revenue, gross margin, operating expenses, profit or loss, burn rate, runway, and the main assumptions behind the forecast.
How many years should a financial projection slide show?
Most pitch decks show three to five years of projections. Three years is often enough for early-stage companies. Five years can work for businesses where long-term scale or project economics matter.
Should a financial projection slide include assumptions?
Yes. Assumptions make the forecast easier to understand and evaluate. Common assumptions include pricing, customer growth, gross margin, retention, units sold, conversion rate, and sales capacity.
Is the financial projection slide the same as the financial model?
No. The financial model is the detailed spreadsheet. The financial projection slide is the simplified investor-facing summary of the model.
Should I show revenue only?
No. Revenue alone is not enough. Investors also need to understand costs, margins, cash burn, runway, and the assumptions that drive the forecast.
What is the biggest mistake founders make with financial projections?
The biggest mistake is showing ambitious revenue growth without explaining the assumptions behind it. Investors need to understand what drives the forecast.
Should early-stage startups include financial projections?
Yes, but the projections should be assumption-driven and realistic. Early-stage investors know the numbers will change, but they still want to see how the founder thinks about growth, cost, and capital.
Where does the financial projection slide go in a pitch deck?
It usually appears after the revenue model, go-to-market, and traction sections, and before the use of funds or fundraising ask.
Can financial projections help with fundraising?
Yes. Clear financial projections can make the fundraising ask more credible because they show how capital supports growth, runway, and the next fundable milestone.
