


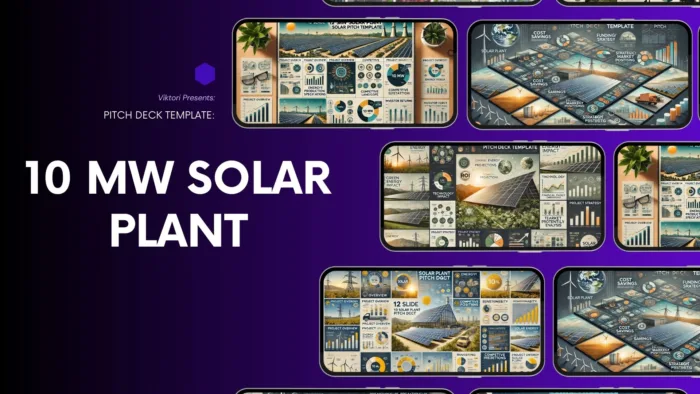
A 10 MW solar plant isn’t a startup idea.
It’s an infrastructure asset.
And that distinction matters — because investors don’t evaluate utility-scale solar the way they evaluate SaaS, climate apps, or “green tech concepts.”
I’m Viktor, a pitch deck consultant and a creative business strategist. Over the past 13 years, I’ve helped businesses secure millions of $ in funding thanks to my approach and I’m sharing it here in this pitch deck guide.
This guide shows you exactly how a 10 MW solar plant pitch deck is expected to be structured, what each slide must prove, and where most solar founders quietly lose credibility.
This is not a generic template.
It’s an investor-grade slide framework built around cash flow, risk, and bankability.
Who This Pitch Deck Is For
This structure is designed for:
- Utility-scale solar projects (~10 MWp)
- Projects preparing for equity, debt, or blended financing
- Developers pitching infrastructure funds, energy-focused PE, utilities, or strategic investors
If you’re looking for a pretty slide theme — this isn’t it.
If you’re trying to get a project financed — keep reading.
Why Most Solar Pitch Decks Fail (Even When the Project Is Solid)
Most solar decks don’t fail because the project is bad.
They fail because the story is wrong.
Common mistakes investors see immediately:
- Business-plan language instead of investment logic
- Generic market growth stats instead of location-specific economics
- IRRs presented without assumptions
- CapEx treated like a fixed number instead of a risk surface
- Slides that explain what solar is instead of why this plant wins
A pitch deck is not a report.
It’s a decision-filter.
What Investors Actually Evaluate in a 10 MW Solar Pitch Deck
Before we get to the slides, here’s the mental checklist investors run — often subconsciously:
- Can this project get built on time?
- Will it connect to the grid without surprises?
- Are revenues contracted or exposed?
- Is CapEx realistic for this geography?
- What kills the downside — and how fast?
- Does the team understand execution risk, or just spreadsheets?
Every slide below exists to answer one of those questions.
Slide 1 — Project Overview
(This slide answers: Is this real, and should I take this seriously? )
What this slide must prove
- This is a specific, executable infrastructure asset
- Not a concept, not a climate vision, not a brochure
If this slide is vague, the deck is dead.
Template (copy structure)
Project Name
10 MWp Solar Power Plant Development
Location
Region, Country (specific municipality preferred)
Project Type
Utility-scale photovoltaic power plant
Development Status
Permitting / Ready-to-build / Under construction
Target Capital
Equity / Debt / Blended financing
Example (10 MW solar plant)
Project Name
Vardar Sun I – 10 MWp Solar Power Plant
Location
Štip Municipality, North Macedonia
Project Type
Ground-mounted utility-scale photovoltaic plant
Development Status
Land secured, grid study completed, permitting in progress
Target Capital
€9.8M total project cost
Seeking €5.8M equity + €4.0M senior debt
No adjectives. No mission.
Just facts an investment committee can repeat internally.
Slide 2 — Investment Snapshot
(This slide answers: Is this worth my time financially? )
What this slide must prove
- You understand returns, structure, and constraints
- You’re not hiding behind optimism
This is a framing slide, not a spreadsheet dump.
Template (copy structure)
Total Project Cost
€X.XM
Capital Structure
XX% Equity / XX% Debt
Revenue Model
PPA / Merchant / Hybrid
Target Returns (Base Case)
Equity IRR: X–X%
Payback: X years
Planned COD
Month / Year
Example
Total Project Cost
€9.8M
Capital Structure
59% Equity / 41% Senior Debt
Revenue Model
15-year fixed-price PPA with national utility
Target Returns (Base Case)
Equity IRR: 11.8%
Payback period: 7.2 years
Planned COD
Q2 2026
If your IRR is 18% here, sophisticated investors stop reading.
Boring numbers build trust.
Slide 3 — Why This Location Works
(This slide answers: Why here, and why not elsewhere? )
What this slide must prove
- Location choice is economic, not emotional
- You understand grid, land, and irradiance together
This is where generic solar decks collapse.
Template (copy structure)
Solar Resource
Site-specific irradiance (kWh/m²/year)
Land Characteristics
Ownership, terrain, zoning status
Grid Access
Distance to substation, available capacity
Permitting Context
Local and national regulatory status
Example
Solar Resource
1,520 kWh/m²/year (site-measured, 10-year average)
Land Characteristics
25 hectares, flat terrain, privately owned, zoned for energy use
Grid Access
1.4 km to 110 kV substation
Grid capacity confirmation received
Permitting Context
Environmental screening completed
Construction permit expected within 6 months
Investors don’t fund countries.
They fund sites.
Slide 4 — Market & Offtake Reality
(This slide answers: How does money reliably enter the project? )
What this slide must prove
- Revenues are contracted or defensible
- You understand counterparty and pricing risk
No one needs another “solar demand is growing” slide.
Template (copy structure)
Offtake Structure
PPA / Merchant / Hybrid
Counterparty
Utility / Corporate / Aggregator
Pricing Assumptions
€/MWh and escalation terms
Contract Duration
X years
Regulatory Context
Support mechanisms or market exposure
Example
Offtake Structure
Fixed-price Power Purchase Agreement
Counterparty
State-owned electricity utility (A-rated)
Pricing Assumptions
€62/MWh, fixed for 15 years
No inflation indexation
Contract Duration
15 years from COD
Regulatory Context
Renewable support framework locked until 2035
This slide tells lenders whether they should relax or tighten.
Slide 5 — Technology & Plant Design
(This slide answers: Will this plant actually perform? )
What this slide must prove
- Conservative technology choices
- No unnecessary experimentation
Solar investors don’t pay premiums for innovation.
Template (copy structure)
PV Modules
Type, manufacturer, efficiency
Mounting System
Fixed-tilt / Single-axis tracking
Inverters
Central / String, redundancy logic
Performance Assumptions
Degradation rate, availability
Example
PV Modules
Monocrystalline PERC modules, Tier-1 manufacturer
Module efficiency: 21.2%
Mounting System
Single-axis tracking to optimize yield
Inverters
Central inverters with N+1 redundancy
Performance Assumptions
Annual degradation: 0.45%
Availability: 98.5%
If this slide sounds exciting, you did it wrong.
Slide 6 — CapEx Breakdown (With Logic)
(This slide answers: Are these numbers believable? )
What this slide must prove
- You understand where overruns happen
- You’ve budgeted for reality, not best case
This is where trust is either earned or lost.
Template (copy structure)
Total CapEx
€X.XM
Key Cost Categories
- Modules
- Inverters & electrical
- EPC & construction
- Grid connection
- Land & development
- Contingency
Contingency
X% of total CapEx
Example
Total CapEx
€9.8M
Cost Breakdown
- PV modules: €3.9M
- Inverters & electrical systems: €1.4M
- EPC & civil works: €2.2M
- Grid connection: €0.9M
- Development & land: €0.8M
- Contingency (6%): €0.6M
Investors don’t fear high CapEx.
They fear unexplained CapEx.
Slide 7 — Operating Economics (OpEx & Asset Longevity)
(This slide answers: Will this plant keep working after year one? )
What this slide must prove
- You understand long-term operating reality
- You’re not pretending solar is “set and forget”
Good solar projects fail slowly, not loudly.
Template (copy structure)
Operating Model
In-house / Third-party O&M
Annual OpEx
€/MW/year
Maintenance Strategy
Preventive + corrective
Insurance & Compliance
Coverage scope
Expected Availability
% uptime
Example
Operating Model
Third-party O&M provider under 5-year renewable contract
Annual OpEx
€95,000 per year (~€9,500/MW)
Maintenance Strategy
Scheduled preventive maintenance
Corrective interventions within 48 hours
Insurance & Compliance
All-risk asset insurance + business interruption
Expected Availability
98.5% average over plant lifetime
Investors don’t ask “will it work?”
They ask “what happens when it doesn’t?”
Slide 8 — Financial Projections (Assumptions First)
(This slide answers: Are these numbers grounded or decorative? )
What this slide must prove
- You understand how returns are created
- You’re not hiding behind Excel gymnastics
This slide earns or destroys credibility.
Template (copy structure)
Revenue Assumptions
€/MWh × annual production
Cost Assumptions
OpEx, degradation, financing
Base Case Metrics
IRR, NPV, DSCR
Sensitivity Highlights
Key downside drivers
Example
Revenue Assumptions
Annual production: ~16.1 GWh
PPA price: €62/MWh
Cost Assumptions
OpEx: €95k/year
Degradation: 0.45% annually
Debt interest rate: 6.1%
Base Case Metrics
Equity IRR: 11.8%
NPV (8% discount): €4.9M
Average DSCR: 1.35×
Sensitivity Highlights
IRR decreases ~1.2% for each 6-month COD delay
IRR decreases ~0.8% for 5% CapEx overrun
Investors trust people who show how things break.
Slide 9 — Project Timeline & Milestones
(This slide answers: Can this team execute without chaos? )
What this slide must prove
- The timeline is credible
- Dependencies are understood
Optimistic timelines are a red flag.
Template (copy structure)
Development Phase
Land, permits, grid
Financing Phase
Equity close, debt close
Construction Phase
EPC, installation
Commissioning
Testing and grid connection
Commercial Operation Date (COD)
Month / Year
Example
Development Phase
Land secured, permits finalized – Q4 2025
Financing Phase
Equity & debt financial close – Q1 2026
Construction Phase
EPC execution – Q1–Q2 2026
Commissioning
Testing and grid synchronization – Q2 2026
Commercial Operation Date (COD)
June 2026
Time is the most expensive risk in infrastructure.
Slide 10 — Risk Assessment & Mitigation
(This slide answers: Does this team understand reality? )
What this slide must prove
- Risks are acknowledged, not ignored
- Mitigation is practical, not theoretical
Pretending risk doesn’t exist kills deals.
Template (copy structure)
Key Risks
- Regulatory
- Grid connection
- EPC execution
- Price volatility
Mitigation Measures
Concrete actions for each risk
Example
Regulatory Risk
Mitigation: Permitting aligned with current national renewable framework valid until 2035
Grid Connection Risk
Mitigation: Capacity confirmation obtained, grid works included in EPC scope
EPC Execution Risk
Mitigation: Fixed-price EPC contract with delay penalties
Price Volatility
Mitigation: Long-term fixed PPA limits merchant exposure
Sophisticated capital doesn’t fear risk.
It fears denial.
Slide 11 — Team & Execution Capability
(This slide answers: Can these people be trusted with capital? )
What this slide must prove
- Relevant experience
- Local execution capability
- Clear accountability
This slide often matters more than the numbers.
Template (copy structure)
Project Sponsor
Background and track record
Key Team Members
Execution roles
Advisors / Partners
Technical, legal, financial
Example
Project Sponsor
Development team with 120+ MW of utility-scale solar delivered in the region
Key Team Members
Project Director – 15 years renewable infrastructure experience
Technical Lead – Former EPC engineering manager
Advisors / Partners
Grid consultant, legal counsel, independent technical advisor
Investors don’t back decks.
They back people who’ve survived construction.
Slide 12 — The Ask & Next Steps
(This slide answers: What decision am I being asked to make? )
What this slide must prove
- Clarity
- Professionalism
- Momentum
Ambiguous asks delay funding.
Template (copy structure)
Capital Required
Total amount and structure
Use of Funds
High-level allocation
Investment Structure
Equity / Debt terms overview
Next Steps
Process and timeline
Example
Capital Required
€5.8M equity investment
Use of Funds
EPC payments, grid connection, development costs
Investment Structure
Minority equity stake with dividend distribution from year one of operation
Next Steps
Due diligence → term sheet → financial close
Good decks end with decisions, not inspiration.
10 MW Solar Plant Pitch Deck Ai Prompt
Bank-Only 10 MW Solar Pitch Deck (DSCR-Driven / Credit Committee Version)
If you want to really dive into the world of pitch decks, check out our complete collection of pitch deck templates.
Related Solar Pitch Deck Templates
The 12 Slide Rooftop Solar Panels Pitch Deck Template
The 12 Slide Community Living Pitch Deck Template

The 12 Slide 4 Well Project Pitch Deck Template
13 Slide Solar Energy SaaS Pitch Deck Template
So, you’ve built a slick solar energy software, but instead of skyrocketing growth, you’re stuck…
17 Slide Zambia Solar Plant Pitch Deck Template
Alright, so you want to build a solar plant in Zambia, right? But maybe you’ve…
12 Slide Solar Sales Pitch Deck Template
You’re probably tired of seeing your electricity bills skyrocket every month, and wondering if there’s…
12 Slide 100MW Solar Panel Manufacturing Plant Pitch Deck Template
You’re standing at the dawn of a new energy revolution. Solar power isn’t just a…
16 Slide 50MW Jamaica Solar Farm Pitch Deck Template
So, you’ve got this grand vision—50MW of pure, unfiltered Jamaican sunshine powering homes, businesses, and…
12-Slide 50 MW Solar Farm Pitch Deck Template
Author: ViktorPitch Deck Expert. Ex Advertising. Founder of Viktori. $500mill In Funding. Bald Since 2010….
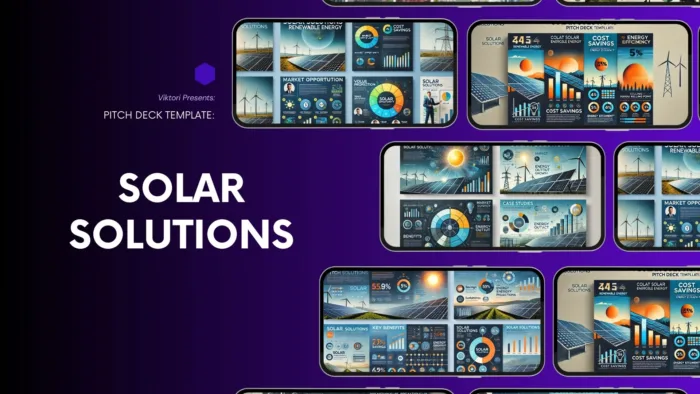
16 Slide Solar Solutions Pitch Deck Template
Let’s start with making a powerful first impression. You’re about to introduce “Innovative Solar Solutions,”…
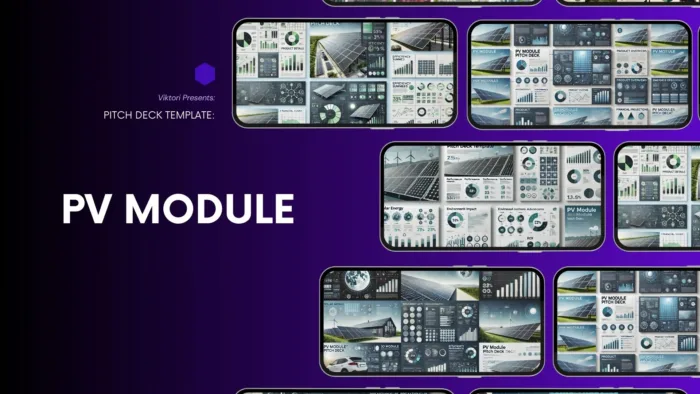
12 Slide PV Module Pitch Deck Template
So, you’ve got this grand vision of revolutionizing the solar energy game, right? You’re all…
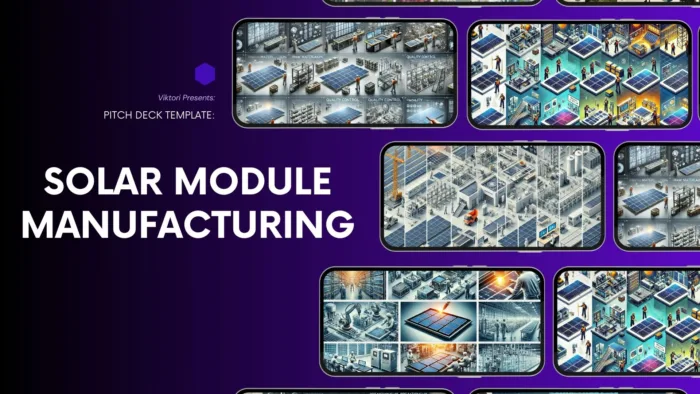
12 Slide Solar Module Manufacturing Pitch Deck Template
So, you’ve got this crazy good idea to launch the next big thing in solar…
10 MW Solar Plant Pitch Deck: 12 Slides Investors Actually Expect (With Real Economics)
A 10 MW solar plant isn’t a startup idea.It’s an infrastructure asset. And that distinction…
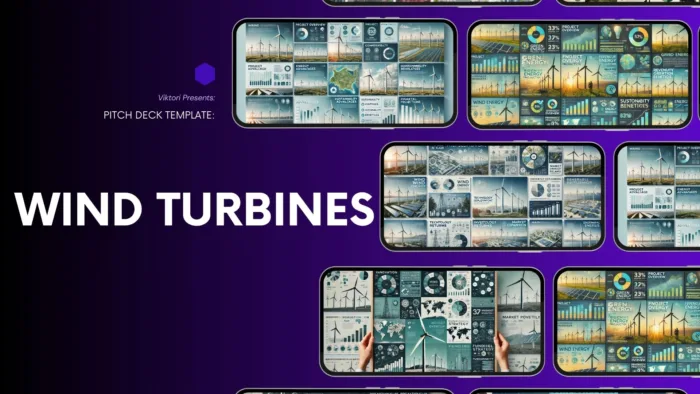
12 Slide Wind Turbines Pitch Deck Template
Ever look at those massive wind turbines and think, “What happens to these giants when…
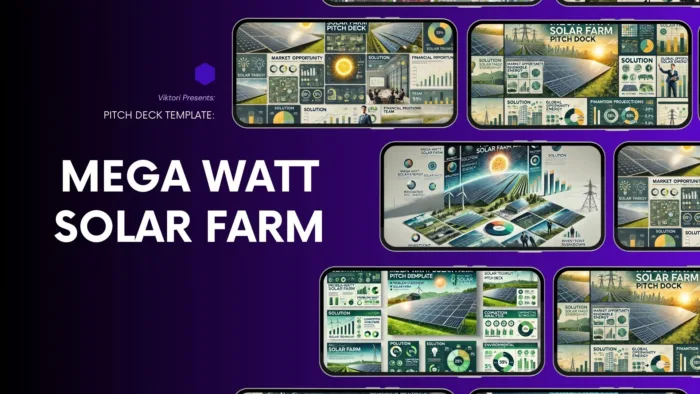
10 Slide Mega-Watt Solar Farm Pitch Deck Template
So, you’ve got plans to harness the sun and power entire cities with your megawatt…
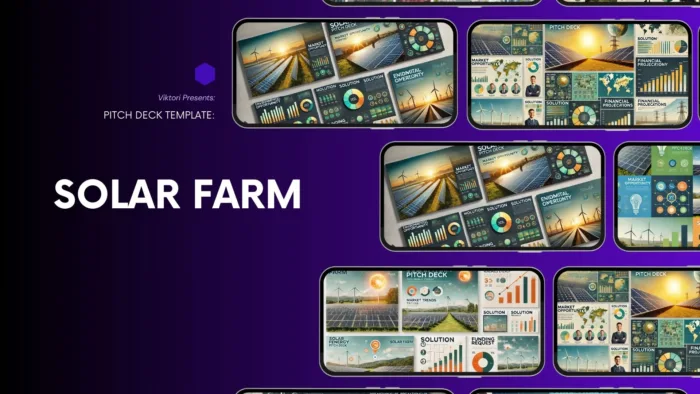
10 Slide Solar Farm Pitch Deck Template
So, you’ve got a solar farm idea that could literally outshine the competition, but when…
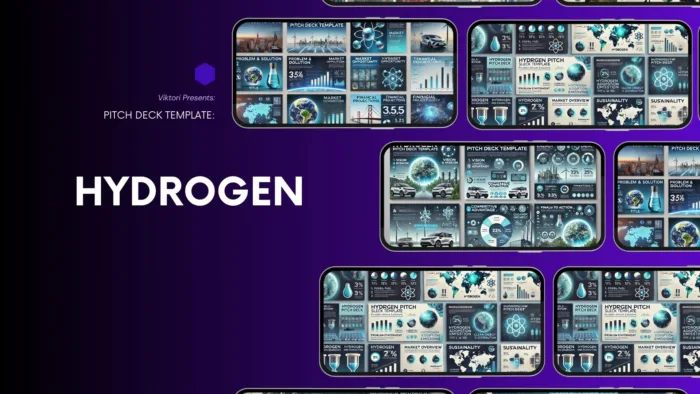
13 Slide Hydrogen Pitch Deck Template
You’ve got this groundbreaking idea to revolutionize clean energy with hydrogen, but every pitch feels…
13 Slide Renewable Energy Blockchain Pitch Deck Template
You’ve cracked the code on renewable energy. Solar panels? Wind turbines? Child’s play compared to…
15 Slide Pitch Deck Template for Solar Companies
Alright, let’s cut to the chase: Solar energy isn’t just the future—it’s the present. But…
16 Slide Energy Pitch Deck Template
Let’s cut straight to it. Energy is the backbone of modern civilization, but we’re not…
Looking for a step by step guide to build a Solar pitch deck?
Check out our in-depth solar pitch deck guide.
Check out some of the essential 101 guides:

Top Pitch Deck Design Agencies: Best Presentation Design Services
Quick Summary A pitch deck design agency helps startups turn complex business ideas into clear,…

How to Create a High-Impact Investment Highlights Slide For Your Pitch Deck
An investment highlights slide is often the moment in a pitch deck when investors decide…

The Why Now Slide in a Startup Pitch Deck
The why now slide explains one simple thing: why this opportunity makes sense right now,…

How to Make a Pecha Kucha Presentation: The 20×20 Format Explained
If you’ve ever sat through a bloated 40-slide presentation that could’ve been said in 10…

5 Types of Pitch Decks And How To Choose The Right One
A pitch deck isn’t “a deck.” It’s a decision surface—a compressed view of a business…

Pitch Deck vs Pitch Book: Investor Guide to Key Differences
Choosing between a pitch deck vs pitchbook matters because each format reflects a different evaluation…