You’re probably here because you’ve got an idea that could change the game – maybe something the industry hasn’t seen before.
You know it’s powerful, but no one’s biting. It’s not the idea that’s the issue – it’s how you’re telling the story. And in this game, the way you pitch can make or break you.
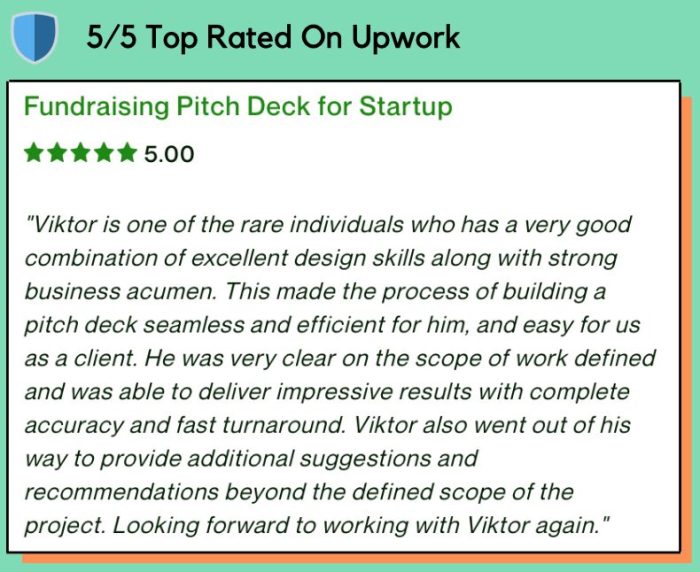
I’m Viktor, a pitch deck expert and creative business strategist. Over the past 13 years, I’ve helped businesses secure millions of $ in funding thanks to my approach and I’m sharing it here in this pitch deck guide.
I’ve helped everyone from scrappy startups to established players get the green light (and yes, I’ve seen my share of flops too). Think of me as your pitch-deck sherpa, here to guide you up that mountain without the fluff or clichés.
Whether you’re going all-in with this pitch or just need a killer template to kick things off, I’ve got you. I’ll help you structure your deck so it’s not just another one in the stack but something that makes investors stop scrolling and start nodding. So let’s break it down, step-by-step, into something you’d actually want to present.
Grab a coffee, and let’s get to work.
Pushing Case Studies Like Pushing Code: Check out our case study on how we helped a SaaS platform for HR develop a pitch deck to raise funding for their next round.
Get My 12 Slide Framework That Got $500mil in Funding For Clients.
What do you think of having 12 dead simple formulas, that will help you craft 12 slides, in about 1 hour? That’s what you’ll get, when you download my 12 slide framework. Save hours crafting your pitch deck copy with my tested approach that includes:
- Elevator pitch one sentence formula
- Problem/ solution slide one sentence formula
- Competitor slide one sentence formula
- 9 other formulas, tips, tricks and advice
The formulas worked for 40+ industries and 500+ companies. Including the one you’re looking at now.
Clicking the link won’t charge you anything.
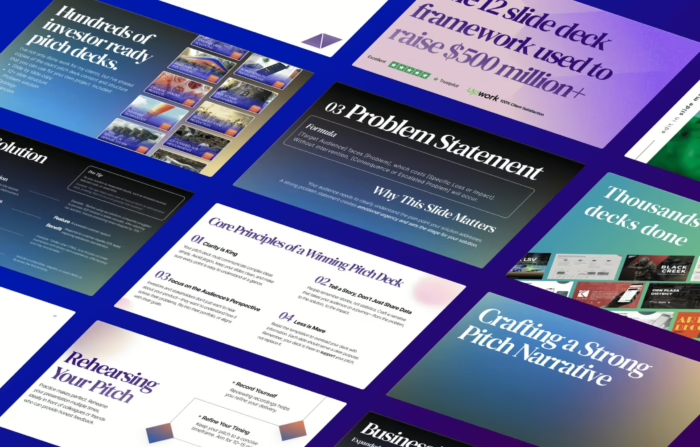
Get an investor ready pitch deck that gets you funded and saves over 30 hours of your time.
Join 100s of successful entrepreneurs who’ve transformed their pitch decks by using my hands-off approach, which includes: market research, copy, design, financials, narrative and strategy.
1 week turnaround time and less. Special pricing for early stage companies.
The least you will get on this call is 10 actionable tips & strategies to own that next pitch, worth $599, for free.
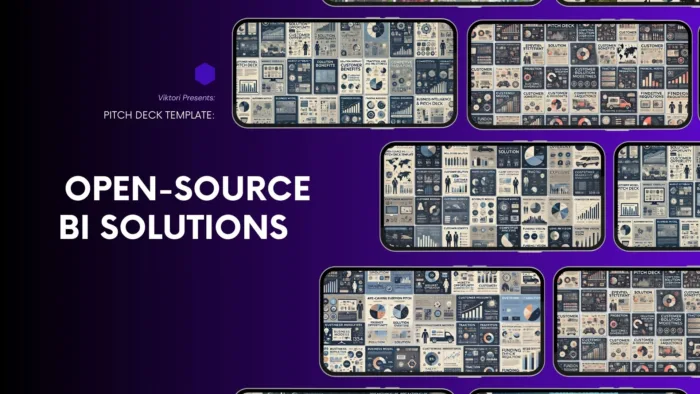
13 Slide Open-Source Bi-Solutions Template | Google Slides
The above is is just a simplified pitch deck version developed as part of our entrepreneurship program for graduate studies.
Founders that are serious about getting the funding they need, opt in for a deck has industry specific content, superb narrative and award winning design like these ones below:


I can help you build that deck with my hands-off process in 7 days or less.
Book a free 30 minute call below if you’re serious about getting an investor ready deck, and we’ll discuss your needs in detail. I’ll help you design the deck, write the content, develop the narrative and flesh out the strategy with financials.

We help 15,000+ founders every month create better pitch decks.
Alternatively, get the custom template for just $69,99.As soon as the payment is processed I’ll send over a quick questionnaire and deliver the deck in 24 hours and less.

Follow us on social for the newest templates:
Slide 1: Elevator Pitch
Headline: “A Straightforward Solution for [Industry Problem]”
- Identify the Core Problem: “Today, [specific problem] affects [x%] of [target industry]. It’s a process marred by [issues such as high costs, inefficiencies, time lags].”
- Urgency and Market Demand: “Customers are looking for alternatives, as [highlight pain points like cost burdens or time inefficiencies].”
- Solution Overview: “[Your Solution] offers a direct approach, designed to cut [costs/time/effort] by [x%]. This solution integrates seamlessly with current workflows.”
- Visuals: Before/after comparison, showing traditional process vs. your streamlined solution in a simple infographic.
Slide 2: Investor Memo
- Opportunity Summary: Briefly describe the significant market gap and the unique advantage of your solution.
- Example: “There is a $20 billion gap in the [specific service] market due to outdated methods that cannot keep up with the demands of [specific modern needs].”
- Market Size Overview: Total Addressable Market (TAM), Serviceable Available Market (SAM), and Serviceable Obtainable Market (SOM).
- Competitive Edge: Detail what gives your solution a competitive advantage (e.g., faster processing, lower costs, improved user experience).
- Projected Growth: Illustrate hypothetical but realistic growth, like reaching $5 million in revenue within three years.
- Visuals: Summary tables and graphs with TAM/SAM/SOM and a concise bullet-point overview of key investment highlights.
Slide 3: Problem and Impact
- Clear Problem Statement: “[Industry Problem] affects [specific segment] in ways that create inefficiency, high cost, and user dissatisfaction.”
- Example: “Data suggests that [x%] of companies face [specific issue] with [existing solutions].”
- Data-Driven Evidence: Use hypothetical or real data to validate the problem.
- Example: “Research shows that 75% of companies experience a [x]% increase in costs due to inefficient [process].”
- Consequences: Explain the implications if this problem continues unaddressed (e.g., financial losses, reduced productivity).
- Visuals: Pie charts or icons showing the scale of the problem.
Slide 4: Market Opportunity
- Market Landscape: Present the market size and growth potential. Use an assumption-based calculation or real data (hypothetical example below).
- TAM: $50 billion
- SAM: $15 billion
- SOM: $3 billion
- Growth Projections: Showcase annual growth rate (e.g., “The industry is projected to grow at a CAGR of 15% over the next five years”).
- Visuals: Graphs showing market size and market opportunity over time.
Slide 5: Solution Overview
- How It Works: Describe the main function of your solution.
- Example: “Our solution simplifies [task] by providing [specific feature] that reduces [effort/time] by [x%].”
- Key Features: Highlight unique attributes that differentiate your solution.
- Value Proposition: Explain what makes it valuable and necessary.
- Example: “Achieves 50% faster turnaround compared to current industry standard.”
- Visuals: A simple diagram showing the solution’s workflow, highlighting key features.
Slide 6: Customer Benefits
- Primary Benefits: Specify key benefits (e.g., cost savings, convenience, scalability).
- Example: “Our users report a [x%] decrease in operational costs and [y%] faster service delivery.”
- Use Cases: Describe specific scenarios where customers see the value.
- Stakeholder-Specific Benefits: Break down benefits for different stakeholders.
- Visuals: Testimonials, user icons, or before/after stats.
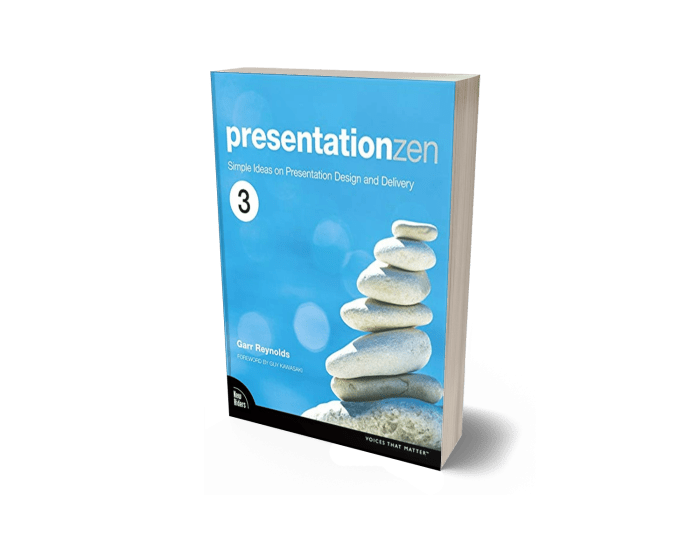
Hold on. You might want to check my list on the best presentation and communication books...
These are crucial books that will help you improve the design and structure of your decks and presentations, besides improving your delivery and skyrocketing your confidence when facing investors. Check them out below.
Slide 7: Business Model
- Revenue Streams: List primary and secondary revenue sources.
- Example: “Monthly subscriptions, on-demand services, and enterprise solutions.”
- Pricing Strategy: Explain your approach to pricing (e.g., tiered pricing).
- Scalability of the Model: Describe how the model adapts as customer base grows.
- Visuals: A chart detailing pricing tiers and projected revenue from each stream.
Slide 8: Traction and Milestones
- Key Metrics to Date: Show user growth, partnerships, and revenue.
- Example: “500 active clients, $250K ARR, 25% MoM growth.”
- Milestones Achieved: Highlight major achievements.
- Upcoming Milestones: Roadmap for future milestones.
- Visuals: Milestone timeline with significant events marked.
Slide 9: Competitive Analysis
- Direct Comparison: List main competitors and highlight differences.
- Example: “We provide [feature] that no competitor currently offers.”
- Competitive Advantage: Define what sets you apart (e.g., unique technology, exclusive partnerships).
- Visuals: Competitor comparison chart.
Slide 10: Financial Projections (Hypothetical)
- Revenue Forecast: Show annual projected revenue over five years.
- Example:
- Year 1: $1M
- Year 2: $3M
- Year 3: $7M
- Year 4: $12M
- Year 5: $20M
- Example:
- Cost Breakdown: Key costs, including operational expenses, marketing, R&D.
- Example: “Annual operating costs projected at $500K initially, scaling to $2M by Year 5.”
- Profitability Timeline: When you anticipate reaching profitability.
- Example: “Projected profitability by end of Year 3.”
- Visuals: Revenue vs. expenses chart, with breakeven line highlighted.
Slide 11: Funding Requirements
- Amount Requested: Specify your funding ask.
- Example: “Seeking $3 million for product development, marketing, and operational expansion.”
- Use of Funds: How you plan to allocate the funding.
- Example breakdown:
- 40% on R&D
- 30% on marketing
- 20% on operations
- 10% on contingency
- Example breakdown:
- Return Potential for Investors: Outline potential ROI.
- Visuals: Pie chart or fund allocation visual.
Slide 12: Team and Advisors
- Core Team: Highlight each member’s expertise and role.
- Example: “John Doe, CEO – 15 years in [relevant industry]; Jane Smith, CTO – former lead engineer at [major tech company].”
- Advisors and Partners: Showcase any advisors and their relevant experience.
- Visuals: Team photos with brief bios and logos of advisor firms.
Slide 13: Vision and Roadmap
- Long-Term Vision: Articulate your 5–10 year vision for the product.
- Example: “In the next five years, we envision expanding to [global market], partnering with major industry players, and becoming the leading solution in [specific niche].”
- Roadmap: List key milestones over the next two years.
- Call to Action: A closing statement encouraging partnership or investment.
- Visuals: Roadmap timeline with key goals and milestones.
Hypothetical Market Size Example
For a hypothetical “bi-solutions” market aimed at data optimization:
- TAM: $50 billion, based on the total global market size for data analytics solutions in healthcare, logistics, and finance.
- SAM: $15 billion, assuming 30% of the TAM is realistically accessible within five years.
- SOM: $3 billion, targeting an initial market entry in specific high-growth regions (e.g., North America and Europe).
These figures can be adjusted based on real market research data.
Last Words
You’ve made it through the essentials – the big idea, the problem, the market, and, most importantly, why your solution is what the world’s been missing. Now, your pitch is solid, no-frills, and ready to impress. Investors want a no-nonsense, straight-to-the-point approach, and that’s exactly what you’ve got.
Just remember, pitching is half art and half strategy. You don’t have to be the loudest in the room – just the one who makes the most sense. You’ve got the blueprint now, and it’s time to make your move.
So go ahead. Take that pitch deck out into the world, and make them see why your idea is the one they need to back. And if you ever feel like you’re missing something, you know where to find me.
You got this!
But if you don’t got it:
Join hundreds of successful entrepreneurs who’ve transformed their pitch decks with my help.
Let me develop an investor ready deck by using my hands-off approach, which includes: market research, copy, design, financials, narrative and strategy.
One week turnaround time.
The least you will get is 10 actionable tips & strategies to own that next presentation, worth $599, for free.

If you want to really dive into the world of pitch decks, check out our complete collection of pitch deck templates.
Related SaaS Pitch Deck Templates
Check out our massive directory of pitch deck templates, or the following related templates:
10 Slide Global Employment Solutions Pitch Deck Template | Google Slides
You’re all set to build a dream team across borders—ready to hire…
11 Slide Data and Risk Intelligence Pitch Deck Template: Turning Complex Metrics into Investor Magic | Google Slides
So, here’s the deal: you’ve got a killer concept for a data…
11 Slide Data Observability Pitch Deck Template | Google Slides
You’ve got the next big thing in data—seriously, your insights could save…
Turn ‘Wait, What’s Your Product Again?’ into ‘Take My Money!’ with This B2B Data Solutions Pitch Deck Template | Google Slides
Alright, let’s cut to the chase. You’ve got reams of data, endless…
Nail Your 15 Slide EdTech Pitch with a Template So Good, It Deserves a Gold Star from Investors | Google Slides
So, you’ve built an app that’s going to change education forever, right?…
Data Doesn’t Lie, and Neither Does This Pitch Deck: Get Funded with A 13 Slide Open-Source Bi-Solutions Template | Google Slides
You’re probably here because you’ve got an idea that could change the…
Looking for a step by step guide to build a SaaS pitch deck?
Check out our in-depth SaaS pitch deck guide.
Check out some of the essential 101 guides:
Mastering the Financial Projections Slide: Turning First Impressions into Lasting Opportunities
You’re convinced your startup is the next big thing, but somehow, your pitch keeps landing…
Creating an Impactful Traction Slide for Your Investor Pitch Deck: A Startup Guide
You’ve got the next unicorn startup brewing, but here’s the harsh reality: your traction slide…
Mastering the Pitch Deck Solution Slide: A Startup’s Guide to Success with Slide Perfection
You’ve got the next big thing, whether it’s a revolutionary SaaS platform or the future…
Mastering Your Pitch Deck Go-to-Market Slide: A Step-by-Step Guide For Startups
Ever pitched your groundbreaking idea, only to be met with blank stares and polite nods?…
Pitch Deck Problem Slide: Template, Examples, Guide
You’ve got a groundbreaking business idea, but somehow, the investors aren’t biting. Here’s the kicker:…
The Elevator Pitch Slide | Examples, Template, Tips & Guide
Imagine having a revolutionary idea that could disrupt an entire industry. You’ve done the hard…

