Right now, you might be sitting on a goldmine of data but without the right tools and strategies, it’s as good as sitting on a pile of rocks. That’s where I come in. I’ve spent the last decade turning data chaos into data clarity and helping businesses thrive in their markets.
I’m Viktor, a pitch deck expert, and a presentation expert. Over the past 13 years, I’ve helped businesses secure millions of $ in funding thanks to my approach and I’m sharing it here in this pitch deck guide.
With this pitch deck template, I’m going to show you how a pitch deck structure looks, and what the scenario feels like that not only captivates your audience but also converts skeptics into believers. You’re not just presenting data; you’re telling a story where numbers are the heroes.
Book a free personalized pitch deck consultation and save over 20 hours of your time.
Join hundreds of successful entrepreneurs who’ve transformed their pitch decks with my help.
Let me develop an investor ready deck by using my hands-off approach, which includes: market research, copy, design, financials, narrative and strategy.
One week turnaround time.
The least you will get is 10 actionable tips & strategies to own that next presentation, worth $599, for free.
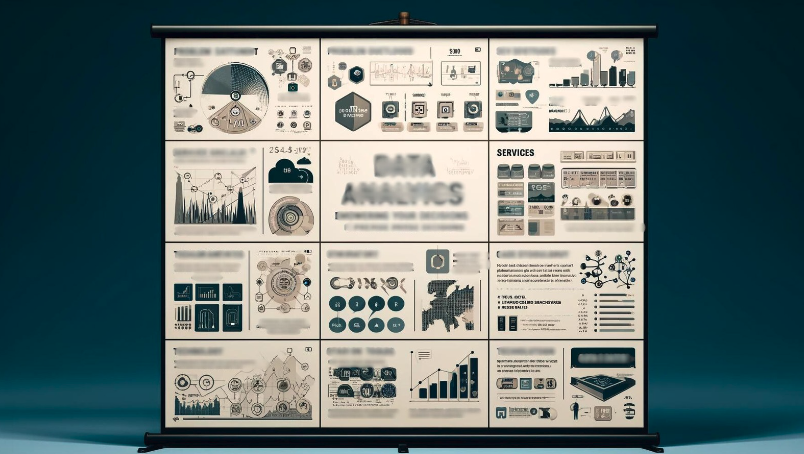
Data Analytics Pitch Deck Template
Want a similar template for your pitch? Book a call free below to discuss more, or reach out through email.
Title Slide:
- Company Name: Data Insights Corp.
- Logo: [Insert high-quality image of company logo]
- Tagline: “Empowering Your Decisions with Data”
- Presenter’s Name and Position: John Doe, Chief Data Analyst
- Date of the Presentation: June 15, 2024
- Visual Elements: Use a clean, professional background with subtle data-related imagery, like graphs or binary codes, faded in the background.
Problem Statement:
- Title: “Navigating the Complexity of Data Overload”
- Content: Begin with a rhetorical question to engage the audience, “Have you ever felt overwhelmed by the sheer volume of data available and uncertain about what to do with it?” Follow this by outlining common industry-specific challenges like siloed data, inaccurate data leading to poor decision-making, and increased operational costs due to inefficiencies.
- Statistics: Include a statistic to highlight the severity of the problem, e.g., “85% of companies believe data overload hampers their growth (Source: Industry Data Analytics Report 2024).”
- Visuals: Use a graph or infographic to visually represent the increase in data creation over the years alongside the rising costs of data mismanagement.
Solution Overview:
- Title: “Tailored Analytics for Precise Decisions”
- Content: Introduce your service as the customized solution to the problems mentioned. Explain briefly how Data Insights Corp. uses advanced analytics to transform raw data into actionable insights.
- Key Features: Mention key features like real-time analytics, predictive modeling, and bespoke reporting.
- Visuals: Include a simple flowchart showing the step-by-step process from data collection to insights generation.
Services Breakdown:
- Title: “Our Comprehensive Suite of Services”
- List of Services:
- Data Integration: Consolidate data from multiple sources into a single, coherent framework.
- Data Cleansing: Enhance data quality by removing or correcting data errors.
- Predictive Analytics: Use statistical models and forecasts to predict future trends.
- Machine Learning: Implement ML algorithms to automate data analysis and gain deeper insights.
- Visuals: Use icons next to each service description for visual reinforcement. Consider a quadrant layout where each service is visually distinct.
Technology and Tools:
- Title: “State-of-the-Art Technology Stack”
- Content: Describe the cutting-edge tools and technologies you employ, such as AI algorithms, cloud data platforms like AWS or Azure, and specific analytics software like Tableau or Power BI.
- Advantages: Briefly discuss why these technologies are advantageous, focusing on aspects like scalability, security, and user-friendliness.
- Visuals: Create a tech stack diagram that visually links these technologies with the services they support.
Case Studies/Success Stories:
- Title: “Proven Impact in Action”
- Case Study 1: Outline a scenario where your analytics service helped a retail client optimize their supply chain. Highlight the problem, your intervention, and the results, such as a 30% reduction in delivery times and a 20% cost saving.
- Case Study 2: Describe how your predictive analytics service enabled a healthcare client to reduce patient readmission rates by predicting high-risk patients. Showcase a reduction in readmission by 25% over one year.
- Visuals: Use before-and-after visuals or graphs showing measurable improvements. Include testimonials from the clients as quotes.
Market Analysis:
- Title: “Growing Demand in a Data-Driven World”
- Content: Explain the increasing importance of data analytics across various industries, emphasizing sectors like healthcare, finance, retail, and technology. Discuss how data analytics is becoming critical for operational efficiency, customer satisfaction, and competitive advantage.
- Market Size & Trends: Present current market statistics and growth projections. For example, “The global data analytics market is expected to grow from $230 billion in 2024 to over $400 billion by 2029.”
- Visuals: Use a bar graph or line chart to depict market growth. Include a pie chart showing the market share by industry to highlight the most lucrative sectors.
Business Model:
- Title: “Flexible and Scalable Business Solutions”
- Content: Describe your pricing model, such as subscription-based for continuous analytics services or project-based for specific analysis tasks. Highlight any unique selling propositions like pay-as-you-go or customized packages.
- Revenue Streams: Detail different revenue streams like consulting fees, monthly subscriptions, and training workshops for client teams.
- Visuals: Create a simple infographic that breaks down the business model and revenue streams. Use icons to represent different pricing structures and services.
Go-to-Market Strategy:
- Title: “Strategic Market Penetration”
- Content: Outline your approach to reaching potential clients, focusing on digital marketing, partnerships with industry leaders, and attendance at major conferences. Describe the sales process, from lead generation to closing deals.
- Key Channels: Detail key channels such as LinkedIn for B2B marketing, industry newsletters, and webinars.
- Visuals: Use a flowchart to depict the sales funnel and a map to show targeted geographic markets.
Team:
- Title: “Led by Industry Experts”
- Content: Introduce key team members with a brief bio for each, focusing on their expertise in data science, industry experience, and previous achievements. Highlight any advisors or board members with notable reputations.
- Team Structure: Show the organizational structure if relevant, and how it supports client needs.
- Visuals: Include professional photos of team members, and use an organizational chart if appropriate.
Financial Projections:
- Title: “Sustainable Growth and Profitability”
- Content: Provide a clear forecast of revenue for the next 3-5 years, emphasizing growth driven by expanding into new markets and launching new services. Discuss profit margins and break-even points.
- Assumptions: State key assumptions such as market growth rates, client acquisition rates, and average deal sizes.
- Visuals: Use line graphs for revenue growth and a table for key financial metrics like profits, costs, and investments.
Closing/Call to Action:
- Title: “Join Us on the Data-Driven Journey”
- Content: Summarize the main reasons a client should choose your data analytics services, such as improved decision-making, cost reduction, and competitive advantage. Encourage them to take the next step, whether that’s scheduling a demo, joining a webinar, or simply contacting for more information.
- Next Steps: Clearly state how interested parties can engage with you, including contact information and links to schedule meetings or demos.
- Visuals: Use a strong, compelling image or graphic that encapsulates the benefit of your services, like a dashboard showing an impressive data visualization.
Pitch Scenario
Slide 1: Title Slide
Speaker: “Welcome everyone. I’m John Doe, Chief Data Analyst at Data Insights Corp. Today, we’re excited to share how our solutions can empower your decisions with data.”
Visual: Display the company logo, tagline, and date of the presentation against a background with subtle data-related imagery like graphs or binary codes.
Slide 2: Problem Statement
Speaker: “Have you ever felt overwhelmed by the sheer volume of data available and uncertain about what to do with it? You’re not alone. Many industries face challenges such as siloed data, inaccuracies leading to poor decision-making, and increased operational costs due to inefficiencies.”
Visual: Show a graph or infographic illustrating the increase in data creation over the years and the rising costs of data mismanagement.
Statistic: “In fact, 85% of companies believe data overload hampers their growth (Source: Industry Data Analytics Report 2024).”
Slide 3: Solution Overview
Speaker: “At Data Insights Corp., we provide tailored analytics for precise decisions. Our advanced analytics transform raw data into actionable insights, addressing the issues you’ve faced.”
Key Features:
- Real-time analytics
- Predictive modeling
- Bespoke reporting
Visual: Include a simple flowchart showing the step-by-step process from data collection to insights generation.
Slide 4: Services Breakdown
Speaker: “Our comprehensive suite of services ensures that your data is not only managed but optimized for better decision-making.”
Services:
- Data Integration: Consolidate data from multiple sources into a single framework.
- Data Cleansing: Enhance data quality by removing or correcting errors.
- Predictive Analytics: Use statistical models to forecast future trends.
- Machine Learning: Implement algorithms to automate data analysis and gain deeper insights.
Visual: Use icons next to each service description for visual reinforcement, possibly in a quadrant layout.
Slide 5: Technology and Tools
Speaker: “We leverage state-of-the-art technology to provide our services, ensuring they are scalable, secure, and user-friendly.”
Tools and Technologies:
- AI algorithms
- Cloud data platforms like AWS or Azure
- Analytics software like Tableau or Power BI
Visual: Create a tech stack diagram linking these technologies with the services they support.
Slide 6: Case Studies/Success Stories
Speaker: “Let me share some examples of how our analytics have made a significant impact.”
Case Study 1: “We helped a retail client optimize their supply chain, resulting in a 30% reduction in delivery times and a 20% cost saving.”
Case Study 2: “Our predictive analytics service enabled a healthcare client to reduce patient readmission rates by predicting high-risk patients, leading to a 25% reduction in readmissions over one year.”
Visual: Use before-and-after visuals or graphs showing measurable improvements. Include testimonials from the clients as quotes.
Slide 7: Market Analysis
Speaker: “The demand for data analytics is growing rapidly across various industries. Data analytics is becoming critical for operational efficiency, customer satisfaction, and competitive advantage.”
Market Size & Trends:
- “The global data analytics market is expected to grow from $230 billion in 2024 to over $400 billion by 2029.”
Visual: Use a bar graph or line chart to depict market growth and a pie chart showing the market share by industry.
Slide 8: Business Model
Speaker: “Our flexible and scalable business model ensures sustainable growth and profitability.”
Revenue Streams:
- Subscription-based for continuous analytics services
- Project-based for specific analysis tasks
- Consulting fees, monthly subscriptions, and training workshops
Visual: Create a simple infographic that breaks down the business model and revenue streams. Use icons to represent different pricing structures and services.
Slide 9: Go-to-Market Strategy
Speaker: “Our strategic market penetration plan involves reaching potential clients through digital marketing, partnerships, and key industry events.”
Key Channels:
- LinkedIn for B2B marketing
- Industry newsletters
- Webinars
Visual: Use a flowchart to depict the sales funnel and a map to show targeted geographic markets.
Slide 10: Team
Speaker: “Our team is led by industry experts with a wealth of experience in data science, technology, and business development.”
Team Members:
- John Doe, Chief Data Analyst: 20 years in data analytics and AI.
- Jane Smith, CTO: Expert in cloud technologies and big data.
- Mike Brown, CFO: Experienced in financial strategy and operations.
Visual: Include professional photos of team members and an organizational chart if relevant.
Slide 11: Financial Projections
Speaker: “Our financial projections show sustainable growth and profitability over the next few years.”
Projections:
- Revenue forecast for the next 3-5 years, emphasizing growth driven by expanding into new markets and launching new services.
- Key financial metrics: profits, costs, and investments.
Visual: Use line graphs for revenue growth and a table for key financial metrics.
Slide 12: Closing/Call to Action
Speaker: “Join us on the data-driven journey. Our analytics services offer improved decision-making, cost reduction, and a competitive edge. Contact us to schedule a demo or learn more about how we can help your business.”
Next Steps:
- Contact information and links to schedule meetings or demos.
Visual: Use a strong, compelling image or graphic that encapsulates the benefit of your services, like a dashboard showing an impressive data visualization.
Last Words
In an era where data is the new oil, having the right tools and strategies to harness its power is crucial. The pitch deck template is designed to address the most pressing challenges in data management and analytics.
By showcasing the comprehensive solutions, state-of-the-art technology, and proven success stories, this pitch deck template is poised to captivate investors and stakeholders alike.
You got this!
But if you don’t got it:
Join hundreds of successful entrepreneurs who’ve transformed their pitch decks with my help.
Let me develop an investor ready deck by using my hands-off approach, which includes: market research, copy, design, financials, narrative and strategy.
One week turnaround time.
The least you will get is 10 actionable tips & strategies to own that next presentation, worth $599, for free.
If you want to really dive into the world of pitch decks, check out our complete collection of pitch deck guides, pitch deck outlines and pitch deck examples. Got a pressing issue? Check out our forum and post your questions there.
For more guidance, check out my data analytics pitch deck guide.
